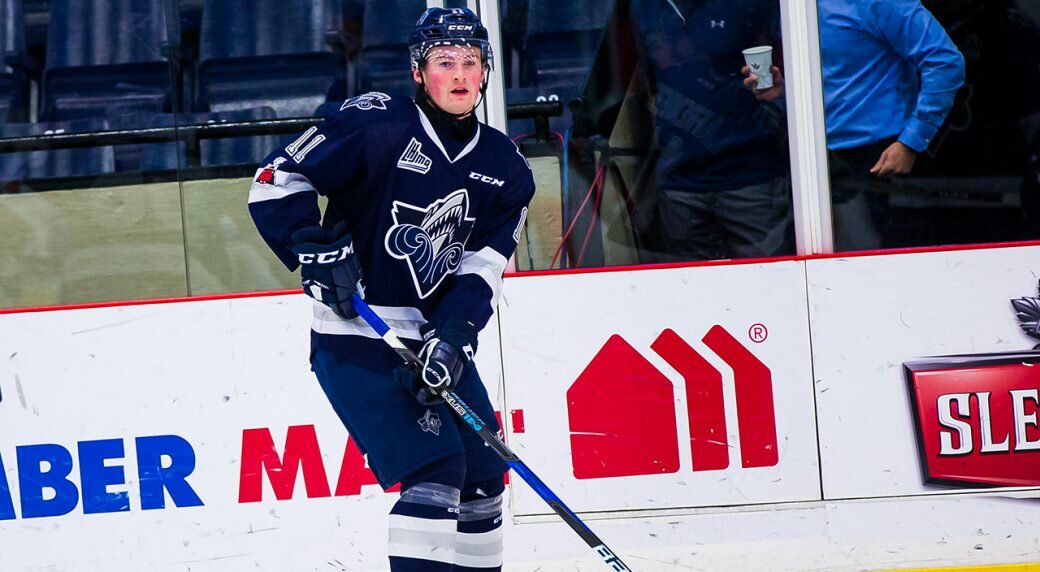
The 2019 NHL Entry is well into the rearview mirror, and now seems as good a time as any to look ahead to next year’s draft.
I had discussions with some peers earlier in the summer about just when it’s appropriate to publish rankings for a draft. Doing so now certainly won’t make us the first – a couple of other prominent services put out shortlists at the same as their final 2019 rankings were released, while others did so shortly after the draft’s completion.
There are others that believe that ranked lists serve no purpose until at least after the World Junior Championship. There’s a logic to this, given that lists published now are lacking a massive amount of essential data. A whole season needs to be played, and in that time players will get hot while others will grow cold; some will leap ahead in their development, while others stagnate and plateau.
However, if you concede these points in advance, admitting that rankings done with nearly 10 months to go are likely to look very little like the final version, you can still gain benefits from producing them.
Benefits of Early Draft Rankings
For one, they’re fun. Fans love rankings, and the more they have to look at, the more opportunity there is for learning, for debate, and later on for criticism sweetly flavored with the benefit of hindsight.
Secondly, early rankings provide a list of players to watch in the coming year. The rank order of them isn’t as important at this point as their mere presence on the list.
Third, I believe there is some benefit in establishing a baseline on players. The draft season can be full of ups and downs, and sometimes players get hot for nearly an entire season. When players jump onto the radar after being previously unheralded, it’s worthwhile to have a base to judge from, before exploring why they improved so greatly in the span of a year.
On Tiering
For the most part, I’m not really a fan of tiering prospects for the draft. My standard philosophy at the draft is that, when it’s your business to rank prospects, you should damn well know which one is better when presented with two options. Tiers can be useful for loosely grouping sets of prospects, but never should a final list have groups in which the individual pieces are said to be interchangeable.
Close to a year in advance, however, I’m a bit more relaxed on that score. For this preliminary list, I am willing to lift my usual moratorium on tiers. We’re fully cognizant of the fact that players are going to move all over the place anyway, so why act like things are set in stone? We have a long way to go.
A Rundown of the Statistical Measures Used
Like our other rankings, and the rankings that I used to publish on CanucksArmy, these are replete with statistics. Many are the same, but there are some new ones as well. What follows is a brief description of each of the stats referenced in the tables below.
- Age: Exact age to two decimal points, calculated as of September 15th, 2018. That date is used for draft purposes – anyone with an exact age greater than or equal to 16.00 and less than 19.00 as of that date will be eligible for the first time at the 2020 draft.
Production Measures
- Box Cars: GP, G, A, P stand for the standard Games Played, Goals, Assists, and Points, during the 2018-19 regular season.
- INV%: Involvement Percentage, or the percentage of team goals that the player had a point on. This has been a pretty standard prospect measurement for a while (I even use a variation of it within my pGPS model), but I particularly like this title for the metric, which was coined by @scouching.
- 5v5 PrINV%: Similar to INV%, but this metric considers only 5-on-5 team goals that the player had a primary point (a goal or first assist) on.
- Pro Impact: a new metric, Pro Impact (or Production Impact) is intended to measure the player’s impact on teammates. It is the difference between the player’s teammates’ 5-on-5 points per hour with and without the player (weighted for common playing time).
- ProAX: another new metric, ProAX (or Production Above Expectation) is designed to measure the player’s ability to produce above and beyond what is expected based on his teammates. It is the difference between a player’s 5-on-5 points per hour and that on his teammates without him (weighted for common playing time).
- ePrP60: Estimated primary points per 60 at 5-on-5. Estimated in conjunction with the eTOI metric described below.
- SEAL: The SEAL adjusted scoring value. SEAL stands for Situational, Era, Age, and League. Here’s a rundown of the current iteration of SEAL, which evolved from a technique that Garret Hohl pioneered for the 2015 draft.
- Sh/GP: Shots on goal per games played.
- Sh%: Shooting percentage.
On-Ice Measures
- eTOI: Estimated 5-on-5 Time on Ice. I have switched over to using Hayden Speak’s method of estimating time-on-ice (the on-ice goals version), described here on prospect-stats.com.
- GF%: Percentage of 5-on-5 on-ice goals scored in favour of the player’s team.
- GF%rel: The difference between the player’s on-ice GF% relative to the team’s GF% when the player is off the ice.
- GF60rel: Relative goals-for per 60 minutes, based on eTOI. The transition to regression-based estimated TOI allows us to better measure goals-for and against rates per hour at the player and team level. This is the difference between the team’s goals-for per hour with the player on the ice versus when he’s on the bench.
- GA60rel: Relative goals-against per 60 minutes, based on eTOI. The same as GF60rel, but for goals against.
Cohort Measures
pGPS is an ever-evolving metric, and while the principles of the model stay roughly the same, the formulations and terminology change from time to time. The following are the definitions of the statistics used in the latest version, which is described in detail here.
- XLS is Expected Likelihood of Success for the player, based on how similar players performed at the NHL level. Rather than the likelihood of simply playing games in the lineup, this number purports to measure the likelihood of being a regular fixture on the top four lines or top three defence pairs.
- Top XLS is the Expected Likelihood of Top 6/Top 4 Success. Similar to the XLS percentage above, this version predicts the likelihood of the player being a top six forward or top four defenceman.
- XPR is Expected Production Rate, the weighted average prime production rate per 82 games of statistical matches that played at least 100 NHL games.
Availability of Metrics
Certain metrics are only available for certain leagues, depending on how easily available the data is to the public. I spent a good portion of my spare time over the past several months developing scrapers for new leagues, meaning that we have more information at our fingertips than ever before. Here’s a run down on which metrics are available in which leagues.
- pGPS: I can run pGPS data on about 20 leagues right now, so at the top of the draft, it’s easier just to say which leagues it doesn’t do. For the purposes of this list, the missing leagues are: the VHL (Russian tier 2 league), MHL (Russian Junior), SM-Liiga Nuorten (Finnish Junior), and the US High School circuit.
- SEAL: Dependent on availability of situational scoring data. SEAL adjustments are currently available for all CHL leagues (WHL, OHL, QMJHL), BCHL, USHL, NCAA, SHL, Allsvenskan, VHL, MHL, Finnish SM-Liiga, Czech Extraliga, and J20 Superelit.
- INV%, Pro Impact, ProAX, GF% and GFrel: Dependent on availability of on-ice records for goals on game sheets. Currently available for all the leagues listed above under SEAL, with the exception of the BCHL, where on-ice players are not included recorded for goals on the game sheets.
Tier 1
Rank | Player | Pos | Age | Height | Nat. | League | GP | G | A | P | 5v5 Pts | SEAL | INV% | 5v5 Pr INV% | 5v5 ePr60 | Pro Impact | ProAX | Sh/GP | Sh% | eTOI | GF% | GF%rel | GF60 rel | GA60 rel | XLS% | Top XLS% | XPR |
1 | Alexis Lafreniere | LW | 16.93 | 6.01 | CAN | QMJHL | 61 | 37 | 68 | 105 | 53 | 2.20 | 43% | 26% | 2.15 | 0.30 | 0.88 | 3.41 | 18% | 14.7 | 73% | 15.6% | 1.86 | -0.28 | 78% | 67% | 65.0 |
Alexis Lafreniere is set to begin his draft season in a tier of his own. The same has been said for many other highly touted prospects, such as Jack Hughes, Nolan Patrick, Auston Matthews and Connor McDavid – so far only only Patrick lost his title so a late season besieger.
It’s conceivable that this year, list many others before it, sees some other prospect challenge Lafreniere for first overall with a shining World Junior performance or dominant playoff run. That type of intrigue drives draft interest in April and May after all. But whether that’s going to be Quinton Byfield, Lucas Raymond, Anton Lundell, Alexander Holtz or some unknown challenger (akin to Patrik Laine or Nico Hischier, who weren’t even considered consensus first round picks heading into their draft years), there mere fact that the is no surefire threat is evidence enough that Lafreniere is separate from the rest.
Tier 2
Rank | Player | Pos | Age | Height | Nat. | League | GP | G | A | P | 5v5 Pts | SEAL | INV% | 5v5 Pr INV% | 5v5 ePr60 | Pro Impact | ProAX | Sh/GP | Sh% | eTOI | GF% | GF%rel | GF60 rel | GA60 rel | XLS% | Top XLS% | XPR |
2 | Quinton Byfield | C | 16.07 | 6.04 | CAN | OHL | 64 | 29 | 32 | 61 | 40 | 1.32 | 26% | 18% | 1.96 | -0.39 | 0.04 | 2.83 | 16% | 12.7 | 61% | 3.4% | 0.83 | 0.22 | 76% | 65% | 60.7 |
3 | Lucas Raymond | RW | 16.47 | 5.10 | SWE | Superelit | 37 | 13 | 35 | 48 | 25 | 0.98 | 35% | 23% | 1.66 | 0.08 | -0.02 | 0.00 | 0% | 14.4 | 75% | 19.4% | 1.64 | -0.58 | 73% | 53% | 41.5 |
4 | Alexander Holtz | RW/LW | 16.64 | 6.00 | SWE | Superelit | 38 | 30 | 17 | 47 | 37 | 0.93 | 35% | 33% | 2.16 | -0.14 | 0.20 | 0.00 | 0% | 15.9 | 64% | 11.2% | 1.80 | 0.17 | 46% | 43% | 49.3 |
5 | Anton Lundell | C/LW | 16.95 | 6.01 | FIN | Liiga | 38 | 9 | 10 | 19 | 14 | 1.46 | 17% | 15% | 0.89 | 0.33 | -0.48 | 0.00 | 0% | 13.5 | 60% | 12.8% | 0.63 | -0.63 | 100% | 35% | 41.4 |
6 | Cole Perfetti | C | 16.70 | 5.10 | CAN | OHL | 63 | 37 | 37 | 74 | 53 | 1.51 | 27% | 22% | 2.81 | 0.63 | 1.10 | 2.62 | 22% | 13.5 | 68% | 10.6% | 1.30 | -0.38 | 56% | 40% | 56.5 |
This second tier is populated by players likely to be first liners throughout their NHL careers, and despite the volatility of a year-in-advance list, they’re each likely to stick in the top ten over the next 11-plus months.
Quinton Byfield, Lucas Raymond and Alexander Holtz have each made a strong case as to why they should be the second best prospect in 2020, and Anton Lundell shouldn’t be forgotten either.
In some ways, Cole Perfetti is the odd one out in this tier, having the least likelihood of breaking into the top three, leaping some of the Europeans between himself and Lafreniere. His numbers speak for themselves, however: his 74 points and 1.51 SEAL adjusted scoring rate are second best of any prospect, and he’s a standout in 5-on-5 primary involvement percentage, production above expectation (ProAX), shots per game, estimate GF60rel and pGPS expected likelihood of success (XLS%).
Tier 3
Rank | Player | Pos | Age | Height | Nat. | League | GP | G | A | P | 5v5 Pts | SEAL | INV% | 5v5 Pr INV% | 5v5 ePr60 | Pro Impact | ProAX | Sh/GP | Sh% | eTOI | GF% | GF%rel | GF60 rel | GA60 rel | XLS% | Top XLS% | XPR |
7 | Marco Rossi | C | 16.98 | 5.09 | AUT | OHL | 53 | 29 | 36 | 65 | 41 | 1.45 | 29% | 20% | 2.39 | 0.93 | 0.67 | 3.11 | 18% | 13.1 | 83% | 22.5% | 1.97 | -1.03 | 48% | 32% | 53.1 |
8 | Noel Gunler | RW/LW | 16.94 | 6.01 | SWE | Superelit | 31 | 27 | 19 | 46 | 29 | 1.02 | 34% | 25% | 2.09 | -0.51 | 0.27 | 0.00 | 0% | 15.7 | 65% | 7.3% | 1.86 | 0.37 | 53% | 32% | 49.8 |
9 | Connor Zary | C | 16.97 | 6.00 | CAN | WHL | 63 | 24 | 43 | 67 | 44 | 1.30 | 39% | 29% | 1.79 | 0.09 | 0.86 | 3.60 | 11% | 14.4 | 57% | 10.9% | 1.35 | 0.20 | 41% | 29% | 47.7 |
10 | Tim Stützle | C | 5.11 | GER | DNL U20 | 21 | 23 | 32 | 55 | – | – | – | – | – | – | – | – | – | – | – | – | – | – | – | – | – | |
11 | Jamie Drysdale | D | 16.44 | 5.11 | CAN | OHL | 63 | 7 | 33 | 40 | 18 | 0.87 | 18% | 8% | 0.61 | 0.06 | 0.13 | 1.84 | 6% | 17.5 | 45% | 0.1% | 0.36 | 0.42 | 25% | 15% | 29.7 |
12 | Dylan Holloway | C/LW | 6.0 | CAN | AJHL | 53 | 40 | 48 | 88 | – | – | – | – | – | – | – | – | – | – | – | – | – | – | – | – | – | |
13 | Jacob Perreault | C | 16.42 | 5.11 | CAN | OHL | 63 | 30 | 25 | 55 | 40 | 1.12 | 22% | 19% | 2.00 | 0.28 | 0.15 | 2.57 | 19% | 13.1 | 52% | 8.3% | 1.22 | 0.04 | 43% | 30% | 51.5 |
14 | Yaroslav Askarov | G | 6.03 | RUS | MHL | 31 | – | – | – | – | – | – | – | – | – | – | – | – | – | – | – | – | – | – | – | – |
The third tier of prospects isn’t far beyond the second. We’ve got our first defencemen, our first goaltender, and a few more forwards. The forwards here are more of the top six variety rather than pure first liners – they could end up being the latter but come with less assurance than those found in tier 2.
At the top of this tier is Austrian born centre Marco Rossi, who lit up the OHL in his rookie season in North America. Rossi’s numbers are nearly off the charts, as he’s in the 99th percentile for SEAL adjusted scoring, involvement percentage, shot rate, goals-for percentage and pGPS expected likelihood of success. In fact, his average percentile among all of the data that I’ve compiled is the highest of any available player, narrowly edging Lafreniere, whom Rossi has bested in 5-on-5 primary points per hour, production impact and relative goals-for percentage.
Kamloops’ Connor Zary is one of four draft-minus-one players to score more than a point per game in Major Junior this season (the others being Lafrenier, Perfetti and Rossi). The list of players since 2009-10 that have scored more than a point per game in their draft-minus-one year in the CHL (minimum 30 games played) is only 21 names long, and includes the likes of Connor McDavid, Nathan MacKinnon, Sean Couturier, Sam Reinhart, Alex Debrincat, Sean Monahan, Travis Konecny and Daniel Sprong. This year’s four players is also the most since 2011-12, when six members of the 2013 draft class achieved the feat.
The rise of Moritz Seider up the rankings this year, culminating with being selected at 6th overall by the Detroit Redwings, was a major boon for German hockey – but Tim Stützle could be even better. The crafty centre combines excellent speed with one-on-one deking ability, a dangerous shot, and high end vision. He’ll follow Seider’s development path as well, joining Adler Mannheim of the DEL next season.
2020 doesn’t presently project to be a great year for defencemen at the high end. Jamie Drysdale looks to be the best available, but he’s no lock for the top ten. That said, draft seasons can do wonders for defencemen, as previously unheralded rearguards jump up team lists late in the year, such as Miro Heiskanen and Cale Makar in 2017, or Moritz Seider and Philip Broberg in 2019. It’s notable, however, that each of these players came from outside North American major junior, allowing them to “sneak up” on scouts as it were. There are no obvious such candidates at this point.
Yaroslav Askarov is generally considered one of the best goaltending prospects to come along in the last several years, and so it’s likely that I’m underselling him at 14. A tantalizing blend of athleticism, technique, compete and composure, he very well could be a top ten pick next June.
Tier 4
Rank | Player | Pos | Age | Height | Nat. | League | GP | G | A | P | 5v5 Pts | SEAL | INV% | 5v5 Pr INV% | 5v5 ePr60 | Pro Impact | ProAX | Sh/GP | Sh% | eTOI | GF% | GF%rel | GF60 rel | GA60 rel | XLS% | Top XLS% | XPR |
15 | Hendrix Lapierre | C | 16.60 | 6.00 | CAN | QMJHL | 48 | 13 | 32 | 45 | 22 | 1.27 | 28% | 17% | 1.67 | -0.15 | 0.47 | 2.13 | 13% | 11.8 | 53% | 4.5% | 0.29 | -0.17 | 20% | 10% | 45.2 |
16 | Justin Barron | D | 16.83 | 6.02 | CAN | QMJHL | 68 | 9 | 32 | 41 | 24 | 0.71 | 14% | 8% | 0.94 | -0.28 | -0.05 | 2.09 | 6% | 14.6 | 71% | 7.1% | 0.19 | -0.50 | 10% | 3% | 23.2 |
17 | Justin Sourdif | C | 16.48 | 5.11 | CAN | WHL | 64 | 23 | 23 | 46 | 37 | 0.91 | 21% | 19% | 1.71 | 0.55 | 1.03 | 2.17 | 17% | 12.5 | 68% | 13.8% | 1.05 | -0.41 | 29% | 23% | 44.0 |
18 | Jean-Luc Foudy | C | 16.34 | 5.11 | CAN | OHL | 63 | 8 | 41 | 49 | 34 | 1.08 | 25% | 18% | 1.59 | 0.18 | 0.41 | 1.90 | 7% | 13.4 | 47% | 1.3% | 0.57 | 0.48 | 32% | 18% | 44.9 |
19 | Simon Kubicek | D | 16.74 | 6.02 | CZE | WHL | 61 | 9 | 19 | 28 | 16 | 0.59 | 14% | 7% | 0.65 | 0.58 | 0.57 | 1.77 | 8% | 14.8 | 58% | 11.1% | 0.78 | -0.56 | 38% | 24% | 26.1 |
20 | Daemon Hunt | D | 16.34 | 6.00 | CAN | WHL | 57 | 7 | 13 | 20 | 16 | 0.48 | 10% | 10% | 0.66 | 0.27 | -0.05 | 1.46 | 8% | 16.3 | 60% | 16.3% | 1.13 | -0.55 | 33% | 18% | 29.5 |
21 | Jan Mysak | F | 16.23 | 5.11 | CZE | Czech | 31 | 3 | 4 | 7 | 7 | 0.76 | 9% | 10% | 0.57 | 0.06 | -0.38 | 0.00 | 0% | 10.4 | 50% | 2.5% | 0.10 | -0.10 | 55% | 17% | 41.0 |
22 | Zion Nybeck | RW | 16.35 | 5.08 | SWE | Superelit | 35 | 17 | 26 | 43 | 26 | 0.93 | 34% | 24% | 1.45 | -0.50 | 0.02 | 0.00 | 0% | 30.6 | 57% | 3.9% | 0.97 | 0.42 | 34% | 31% | 40.4 |
23 | Rodion Amirov | F | 16.95 | 5.11 | RUS | MHL | 31 | 13 | 13 | 26 | 20 | 0.00 | 23% | 20% | 2.65 | 0.52 | 0.88 | 0.00 | 0% | 13.1 | 76% | 9.6% | 0.94 | -0.34 | 3% | 3% | 38.6 |
The fourth tier once again increases in volatility; this group contains a handful of wildcards that have the potential to bust out this season and really increase their draft stock. Barring severe regression, they each have solid chances at going in the first round.
Justin Barron is just the second defenceman on my list, kicking off the back half of the would-be first round. Given the aforementioned trends of defencemen at the time of the draft, keep an eye on players like Barron, Simon Kubicek and Daemon Hunt to gain some helium as the season progresses.
Jan Mysak is a player that might have flown under the radar thus far, but after putting up seven points in 31 games in the top Czech league as a 16-year old (comparable to players like Jiri Hudler and Michael Frolik), he’s a player to keep an eye on next season. Mysak also destroyed the Czech U19 league to the tune of 21 points in 9 games, and was above a point per game with the pro squad over seven games as they staved off relegation. An intelligent, two-way winger with play-making upside, Mysak was chosen 20th overall in the CHL Import draft by Hamilton, but my understanding is that he’ll be staying at home to play with HC Litvinov for his draft season.
Tier 5
Rank | Player | Pos | Age | Height | Nat. | League | GP | G | A | P | 5v5 Pts | SEAL | INV% | 5v5 Pr INV% | 5v5 ePr60 | Pro Impact | ProAX | Sh/GP | Sh% | eTOI | GF% | GF%rel | GF60 rel | GA60 rel | XLS% | Top XLS% | XPR |
24 | Jeremie Poirier | D | 16.29 | 6.00 | CAN | QMJHL | 61 | 6 | 15 | 21 | 10 | 0.42 | 14% | 5% | 0.33 | 0.41 | -0.07 | 0.00 | 0% | 15.3 | 34% | 3.2% | 0.17 | -0.32 | 6% | 2% | 22.6 |
25 | Will Cuylle | LW | 16.37 | 6.02 | CAN | OHL | 63 | 26 | 15 | 41 | 30 | 0.85 | 21% | 18% | 1.79 | 0.37 | 0.10 | 2.95 | 14% | 12.5 | 56% | 14.3% | 1.17 | -0.64 | 33% | 17% | 44.8 |
26 | Jaromir Pytlik | C | 16.97 | 6.02 | CZE | OHL | 26 | 11 | 8 | 19 | 16 | 0.86 | 16% | 15% | 1.97 | 0.75 | 0.14 | 1.85 | 23% | 12.8 | 70% | 12.2% | 1.42 | -0.50 | 22% | 10% | 41.4 |
27 | Theo Rochette | C | 16.57 | 5.10 | SUI | QMJHL | 59 | 14 | 29 | 43 | 27 | 0.92 | 23% | 14% | 1.23 | 0.25 | 0.51 | 1.56 | 15% | 12.0 | 61% | 15.7% | 0.90 | -0.65 | 12% | 6% | 41.9 |
28 | Seth Jarvis | RW | 16.62 | 5.09 | CAN | WHL | 61 | 16 | 23 | 39 | 32 | 0.84 | 17% | 19% | 2.26 | 0.10 | 0.90 | 2.13 | 12% | 10.7 | 58% | 5.1% | 0.35 | -0.26 | 17% | 6% | 33.1 |
29 | Dylan Robinson | D | 16.37 | 6.03 | CAN | OHL | 42 | 3 | 8 | 11 | 22 | 0.39 | 13% | 10% | 1.56 | 0.93 | 0.59 | 1.32 | 40% | 27.7 | 110% | 18.6% | 0.05 | -1.85 | 35% | 16% | 58.1 |
30 | Dawson Mercer | RW | 16.88 | 6.00 | CAN | QMJHL | 68 | 30 | 34 | 64 | 42 | 1.27 | 19% | 17% | 2.81 | -0.19 | 0.23 | 2.99 | 15% | 11.5 | 69% | -1.4% | -0.01 | 0.12 | 15% | 8% | 44.4 |
31 | Carter Souch | F | 16.88 | 5.09 | CAN | WHL | 68 | 10 | 35 | 45 | 35 | 0.86 | 17% | 17% | 2.04 | 0.62 | 0.85 | 1.74 | 8% | 11.5 | 65% | 7.9% | 0.51 | -0.37 | 12% | 4% | 31.6 |
32 | Lukas Cormier | D | 16.47 | 5.10 | CAN | QMJHL | 63 | 15 | 21 | 36 | 20 | 0.67 | 18% | 9% | 0.76 | 0.17 | 0.08 | 2.17 | 11% | 15.9 | 63% | 9.1% | 0.62 | -0.40 | 10% | 2% | 21.2 |
33 | Ty Smilanic | F | 16.65 | 6.01 | USA | USHL | 33 | 9 | 8 | 17 | 9 | 0.57 | 21% | 17% | 1.04 | -0.36 | -0.35 | 2.45 | 11% | 12.6 | 27% | -7.3% | -0.18 | 1.04 | 5% | 4% | 51.9 |
34 | Braden Schneider | D | 16.99 | 6.02 | CAN | WHL | 58 | 8 | 16 | 24 | 12 | 0.53 | 13% | 7% | 0.67 | 0.32 | 0.28 | 1.83 | 8% | 13.3 | 52% | 3.9% | -0.11 | -0.54 | 24% | 12% | 26.1 |
35 | Mavrik Bourque | C | 16.68 | 5.10 | CAN | QMJHL | 64 | 25 | 29 | 54 | 24 | 0.83 | 32% | 24% | 1.75 | 0.11 | 0.69 | 0.00 | 0% | 9.2 | 41% | 9.5% | 1.05 | 0.02 | 17% | 11% | 45.9 |
36 | Tyler Tullio | C | 16.45 | 5.09 | CAN | OHL | 60 | 15 | 27 | 42 | 27 | 0.96 | 16% | 15% | 2.05 | 0.14 | 0.09 | 2.23 | 11% | 11.3 | 60% | 2.8% | 0.14 | -0.19 | 25% | 13% | 43.5 |
37 | Logan Morrison | C | 16.19 | 5.11 | CAN | OHL | 47 | 14 | 20 | 34 | 12 | 0.94 | 19% | 9% | 1.11 | 0.31 | -0.19 | 1.62 | 18% | 10.9 | 46% | 3.3% | -0.01 | -0.48 | 34% | 20% | 45.5 |
As we head into the fifth tier, things only get murkier. This group of players is less certain than any above, but have pretty good shots at playing NHL games should they receive NHL directed development. Many of them will be first rounders, and while some will fall, they should all stay within the top two or three rounds, barring season-compromising injuries.
Other Names to Consider
At this point, we’ve gotten into names that are merely interesting to keep in mind. Chances are, a handful of these players will get picked in the first round, while a handful of others won’t get drafted at all; the rest will be sprinkled somewhere in between.
Rank | Player | Pos | Age | Height | Nat. | League | GP | G | A | P | 5v5 Pts | SEAL | INV% | 5v5 Pr INV% | 5v5 ePr60 | Pro Impact | ProAX | Sh/GP | Sh% | eTOI | GF% | GF%rel | GF60 rel | GA60 rel | XLS% | Top XLS% | XPR |
38 | Dylan Peterson | C | 16.68 | 6.04 | USA | USHL | 31 | 3 | 8 | 11 | 8 | 0.00 | 15% | 14% | 0.82 | -0.27 | -0.40 | 1.45 | 7% | 12.8 | 31% | -2.4% | 0.13 | 0.72 | 6% | 4% | 39.8 |
39 | Ryan O’Rourke | D | 16.33 | 6.02 | CAN | OHL | 62 | 8 | 14 | 22 | 14 | 0.50 | 8% | 7% | 1.05 | -0.31 | -0.25 | 0.89 | 15% | 12.8 | 56% | -1.8% | -0.79 | -0.41 | 18% | 10% | 27.8 |
40 | Rhett Rhinehart | D | 16.80 | 6.03 | CAN | WHL | 68 | 5 | 19 | 24 | 14 | 0.46 | 16% | 9% | 0.49 | -0.08 | 0.25 | 1.84 | 4% | 14.4 | 40% | 1.1% | 0.06 | -0.04 | 25% | 11% | 24.6 |
41 | Ozzy Wiesblatt | RW | 16.52 | 5.10 | CAN | WHL | 64 | 15 | 24 | 39 | 30 | 0.77 | 14% | 11% | 1.74 | 0.65 | -0.11 | 1.67 | 14% | 11.2 | 70% | 3.9% | 0.28 | -0.22 | 19% | 7% | 32.6 |
42 | Kaiden Guhle | D | 16.66 | 6.03 | CAN | WHL | 65 | 3 | 14 | 17 | 9 | 0.35 | 6% | 3% | 0.60 | 0.59 | -0.02 | 1.14 | 4% | 11.7 | 62% | -7.1% | -1.51 | -0.17 | 14% | 4% | 23.1 |
43 | Patrick Guay | LW/C | 16.38 | 5.09 | CAN | QMJHL | 54 | 18 | 18 | 36 | 22 | 0.92 | 18% | 14% | 1.37 | -0.39 | -0.51 | 2.33 | 14% | 13.3 | 43% | -9.4% | -0.20 | 0.98 | 11% | 6% | 42.7 |
44 | Brandon Coe | RW | 16.79 | 6.03 | CAN | OHL | 65 | 17 | 20 | 37 | 29 | 0.69 | 17% | 14% | 1.25 | -0.66 | -0.41 | 1.60 | 16% | 13.2 | 41% | -6.0% | 0.05 | 0.96 | 16% | 6% | 36.3 |
45 | Aidan Prueter | C | 16.73 | 5.10 | CAN | OHL | 66 | 12 | 26 | 38 | 30 | 0.69 | 15% | 10% | 1.13 | -0.35 | -0.27 | 2.26 | 8% | 13.2 | 45% | -8.5% | -0.26 | 0.80 | 14% | 5% | 38.1 |
46 | Ridly Greig | F | 16.10 | 5.11 | CAN | WHL | 63 | 14 | 21 | 35 | 28 | 0.79 | 17% | 17% | 1.58 | 0.22 | 0.36 | 1.97 | 11% | 12.3 | 53% | 4.9% | 0.61 | 0.03 | 22% | 8% | 37.0 |
47 | Antonio Stranges | C/LW | 16.61 | 5.10 | USA | OHL | 66 | 13 | 21 | 34 | 28 | 0.69 | 12% | 12% | 1.92 | 0.21 | 0.26 | 1.76 | 11% | 11.0 | 59% | 1.7% | -0.13 | -0.27 | 16% | 5% | 37.3 |
48 | Connor McClennon | F | 16.22 | 5.09 | CAN | WHL | 46 | 14 | 15 | 29 | 19 | 0.92 | 23% | 22% | 1.83 | 0.06 | 0.31 | 2.52 | 12% | 12.4 | 39% | 1.2% | 0.42 | 0.46 | 13% | 5% | 31.6 |
49 | Helge Grans | D | 16.32 | 6.02 | SWE | Superelit | 34 | 5 | 12 | 17 | 5 | 0.16 | 20% | 14% | 0.24 | 0.21 | 0.13 | 0.00 | 0% | 14.2 | 33% | -9.2% | -0.05 | 0.59 | 15% | 6% | 20.3 |
50 | Vasili Ponomaryov | F | 16.51 | 5.10 | RUS | MHL | 37 | 9 | 20 | 29 | 0 | 0.00 | 0% | 0% | 0.00 | 0.00 | 0.00 | 0.00 | 0% | 0.0 | 0% | 0.0% | 0.00 | 0.00 | 8% | 8% | 77.9 |
51 | Kasper Simontaival | F | 16.68 | 5.09 | FIN | Liiga | 5 | 0 | 2 | 2 | 2 | 1.50 | 13% | 15% | 1.57 | -0.52 | 0.21 | 0.00 | 0% | 9.2 | 40% | -12.4% | -0.80 | 0.80 | 49% | 24% | 45.8 |
52 | Tyler Kleven | D | 16.68 | 6.04 | USA | USHL | 31 | 2 | 1 | 3 | 1 | 0.13 | 4% | 2% | 0.15 | 0.24 | -0.51 | 1.48 | 4% | 14.0 | 23% | -14.0% | -0.95 | 0.43 | 13% | 6% | 24.6 |
53 | Mitchell Miller | D | 16.74 | 5.11 | USA | USHL | 48 | 4 | 12 | 16 | 10 | 0.48 | 11% | 10% | 0.89 | 0.15 | 0.64 | 1.71 | 5% | 11.4 | 55% | 7.4% | 0.26 | -0.36 | 20% | 9% | 24.6 |
54 | Samuel Eriksson | C/LW | 18.98 | 6.01 | SWE | SHL | 0 | 0 | 0 | 0 | 0 | 0.00 | 0% | 0% | 0.00 | 0.00 | 0.00 | 0.00 | 0% | 0.0 | 0% | 0.0% | 0.00 | 0.00 | 0% | 0% | 0.0 |
55 | Cameron Butler | RW | 16.27 | 6.04 | CAN | OHL | 64 | 18 | 8 | 26 | 20 | 0.55 | 12% | 12% | 1.62 | 0.01 | 0.01 | 1.63 | 17% | 11.0 | 51% | 1.8% | -0.09 | -0.31 | 20% | 8% | 34.4 |
56 | Ben King | F | 16.34 | 6.01 | CAN | WHL | 48 | 5 | 21 | 26 | 20 | 0.69 | 28% | 17% | 1.05 | 0.43 | 0.69 | 2.23 | 5% | 12.2 | 43% | 17.2% | 1.19 | -0.66 | 20% | 7% | 32.0 |
57 | Eamon Powell | D | 16.35 | 5.11 | USA | USHL | 34 | 4 | 9 | 13 | 8 | 0.56 | 16% | 9% | 0.46 | -0.11 | 0.48 | 1.38 | 9% | 15.2 | 33% | 3.3% | 0.23 | -0.12 | 25% | 13% | 25.0 |
58 | Owen Gallatin | D | 16.25 | 5.08 | USA | USHL | 34 | 2 | 8 | 10 | 3 | 0.43 | 13% | 6% | 0.43 | 0.13 | -0.17 | 0.97 | 6% | 13.6 | 34% | 4.1% | 0.00 | -0.73 | 24% | 7% | 23.7 |
59 | Hayden Fowler | C | 16.98 | 5.10 | CAN | OHL | 25 | 8 | 10 | 18 | 16 | 0.94 | 23% | 22% | 1.66 | -0.10 | -0.11 | 1.76 | 18% | 15.5 | 50% | 7.7% | 1.45 | 0.57 | 16% | 6% | 40.5 |
60 | Jake Neighbours | LW | 16.47 | 5.11 | CAN | WHL | 47 | 11 | 13 | 24 | 12 | 0.66 | 13% | 9% | 1.51 | -0.63 | -0.36 | 1.66 | 14% | 9.8 | 56% | -5.3% | -0.85 | -0.14 | 17% | 6% | 32.3 |
61 | Ruben Rafkin | D | 16.68 | 5.11 | FIN | USHL | 38 | 2 | 8 | 10 | 8 | 0.38 | 8% | 6% | 0.58 | 0.02 | 0.02 | 0.84 | 6% | 14.0 | 57% | -1.9% | -0.20 | 0.02 | 18% | 7% | 23.8 |
62 | Jake Sanderson | D | 16.19 | 6.01 | USA | USHL | 22 | 2 | 5 | 7 | 3 | 0.43 | 14% | 8% | 0.39 | -0.26 | -0.04 | 2.14 | 4% | 14.1 | 17% | -15.2% | -0.94 | 0.74 | 18% | 9% | 27.5 |
63 | Jacob Truscott | D | 16.43 | 6.00 | USA | USHL | 33 | 2 | 6 | 8 | 6 | 0.36 | 10% | 6% | 0.44 | -0.39 | 0.21 | 1.42 | 4% | 13.6 | 38% | 7.6% | 0.19 | -0.91 | 17% | 9% | 24.8 |
64 | Jack Thompson | D | 16.49 | 6.01 | CAN | OHL | 52 | 6 | 10 | 16 | 9 | 0.41 | 8% | 4% | 0.68 | 0.10 | 0.22 | 1.58 | 7% | 11.2 | 65% | 4.9% | -0.94 | -0.98 | 16% | 8% | 25.5 |
Dad, husband, hockey fan. Founder/analyst/editor/admin of NextGenHockey.ca. Contributor at CanucksArmy and the Nation Network. Blending video analysis and statistical modeling. pGPS, SEAL, etc. The Minnesota Twins are finally good again!