

A popular exercise over the past 10 years or so has been to assign value to each individual draft slot. There are a couple of useful applications for this: one, values can be added and compared when considered trade options for moving up or down in the draft; two, they allow for the evaluation of a team’s draft performance relative to expectation.
There are no shortage of versions of this exercise, though I’d wager that the most prominent work is that of Michael Schuckers, which you can find here. It’s from 2011, but is holding up just fine.
One of the pitfalls that I see with the standard approach (using results from old drafts to approximate value in future ones) is that not all draft classes are the same. In order to maximize the effectiveness of draft slot evaluation, the values should be tailored to the individual classes.
This adds a degree of difficulty, but is certainly doable when you have a model designed to predict likelihood of NHL success. Using our in-house cohort model, pGPS (the Prospect Graduation Probabilities System), we can evaluate all of the players available and tailor draft slots valuations based on the class’s individual strength.
I did this once for CanucksArmy a couple of years ago, with the intention of evaluating team draft hauls by the valuations (though I never got around to it). I’ve done things a little differently this time around. For one, I am using pGPS’ Expected Likelihood of Success (XLS) metric as the measuring stick, as opposed to a hybrid value created by combining percentages with production – I’ve found that percentages are the best predictors of future success, both in terms of games played and production, so there is no need to complicate things beyond that for our purposes here.
Second, I’ve not taken consolidated rankings into account – instead of taking the top ranked players, I have simply taken the 300 best players according to XLS and created a logarithmic trendline from there. Draft eligible players, whether first time or over-aged, from more than a dozen prominent feeder leagues are included.
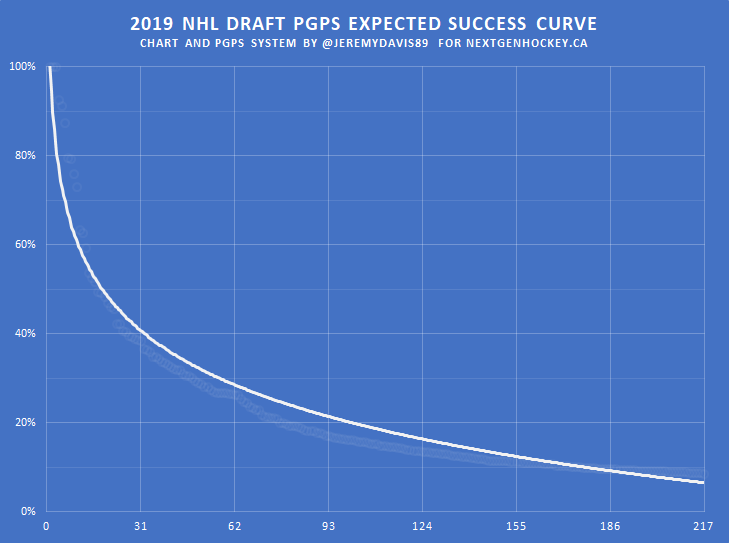
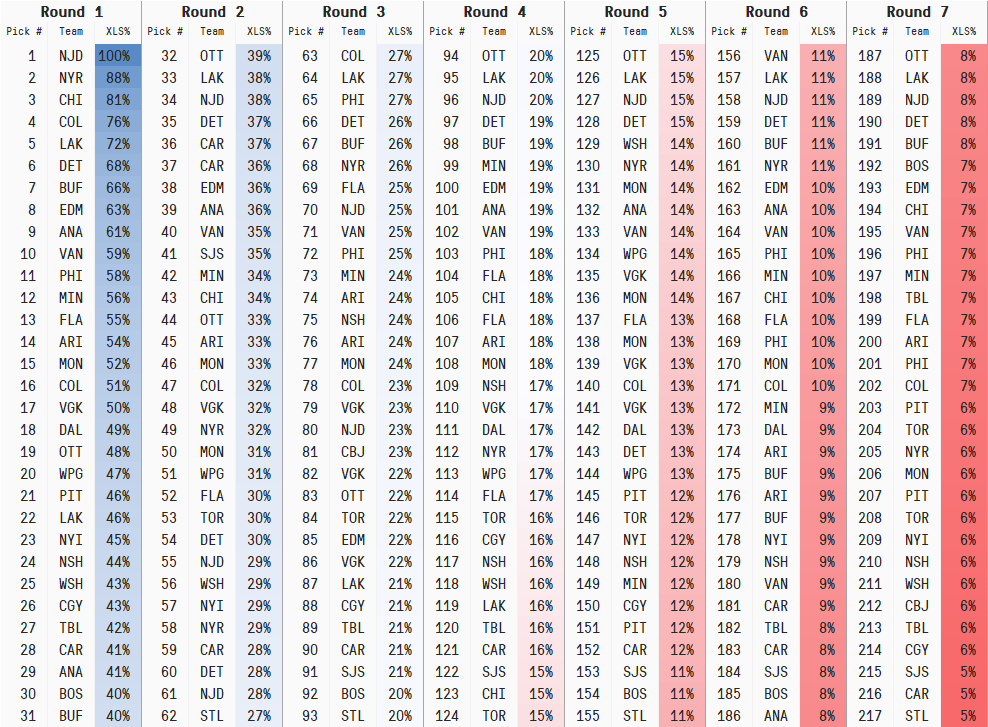
The trendline provides expected percentages at each individual draft slot. I’ve taken the liberty of adding those percentages to a table, along with the teams currently in line to pick at those spots, colourized blue-to-red, from near certainty to long shot.
Finally, I’ve gathered all of the expected percentages up and grouped them by teams, resulting in the following team totals. The values along the y-axis are really just sums of percentages, but you can think of them as crude approximations of the number of full time NHL players that each team can expect to get from this weekend’s draft.
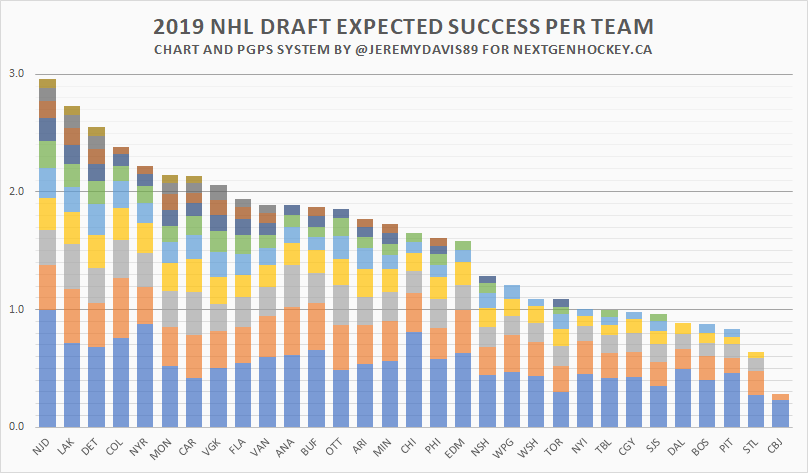
It comes as no surprise that the team that holds the highest draft also holds the greater potential for returned value – but it also certainly helps that New Jersey is holding ten picks. Four other teams (Los Angeles, Detroit, Montreal and Carolina) also hold ten picks, while three more (Vegas, Florida and Vancouver) hold nine.
Towards the end of the spectrum, teams like Boston, Dallas and Pittsburgh would do well to get a single permanent player, while the champs in St. Louis will be in tough to do the same. Columbus, with their first pick at 81st and the only other pick in the 7th round, could just not show up at all and it wouldn’t make much difference. Then again, this is the exact type of situation that you need your scouts and analysts outworking and outwitting their counterparts to find a diamond in the rough.
Once the excitement from the draft subsides and things settle down, we intend to utilize these draft slots values to assess the success of each team from a statistical standpoint – as well as working in the other forms of evaluation we have at our disposal.
Dad, husband, hockey fan. Founder/analyst/editor/admin of NextGenHockey.ca. Contributor at CanucksArmy and the Nation Network. Blending video analysis and statistical modeling. pGPS, SEAL, etc. The Minnesota Twins are finally good again!